Magnetism and Palaeomagnetism
Type of resources
Keywords
Publication year
Topics
-
Total magnetic intensity (TMI) data measures variations in the intensity of the Earth magnetic field caused by the contrasting content of rock-forming minerals in the Earth crust. Magnetic anomalies can be either positive (field stronger than normal) or negative (field weaker) depending on the susceptibility of the rock. The data are processed via standard methods to ensure the response recorded is that due only to the rocks in the ground. The results produce datasets that can be interpreted to reveal the geological structure of the sub-surface. The processed data is checked for quality by GA geophysicists to ensure that the final data released by GA are fit-for-purpose. This magnetic grid has a cell size of 0.002 degrees (approximately 210m). The data used to produce this grid was acquired in UNKNOWN by the UNKNOWN Government, and consisted of UNKNOWN line-kilometres of data at 200.0m line spacing and UNKNOWNm terrain clearance.
-
Total magnetic intensity (TMI) data measures variations in the intensity of the Earth magnetic field caused by the contrasting content of rock-forming minerals in the Earth crust. Magnetic anomalies can be either positive (field stronger than normal) or negative (field weaker) depending on the susceptibility of the rock. The data are processed via standard methods to ensure the response recorded is that due only to the rocks in the ground. The results produce datasets that can be interpreted to reveal the geological structure of the sub-surface. The processed data is checked for quality by GA geophysicists to ensure that the final data released by GA are fit-for-purpose. This magnetic grid has a cell size of 0.001 degrees (approximately 110m). The data used to produce this grid was acquired in 2000 by the WA Government, and consisted of 10950.0 line-kilometres of data at 400.0m line spacing and 80.0m terrain clearance.
-
Total magnetic intensity (TMI) data measures variations in the intensity of the Earth magnetic field caused by the contrasting content of rock-forming minerals in the Earth crust. Magnetic anomalies can be either positive (field stronger than normal) or negative (field weaker) depending on the susceptibility of the rock. The data are processed via standard methods to ensure the response recorded is that due only to the rocks in the ground. The results produce datasets that can be interpreted to reveal the geological structure of the sub-surface. The processed data is checked for quality by GA geophysicists to ensure that the final data released by GA are fit-for-purpose. This magnetic grid has a cell size of 0.002 degrees (approximately 200m). The data used to produce this grid was acquired in UNKNOWN by the WA Government, and consisted of UNKNOWN line-kilometres of data at 300.0m line spacing and 60.0m terrain clearance.
-
This dataset contains scanned geomagnetic magnetogram records from Australian Geomagnetic Observatories. Files names delineate the observatory, observation year, type of data, month range, folder and page. e.g. TOO 1985 GRAM - JUL - AUG - 73_00031 (TOO: Toolangi Observatory)(1985: Year)(GRAM: Magnetogram)(JUL - AUG: month range)(73_00031: Folder and page). Files are stored as station and year based PDF and individual tiff files per page.
-
This dataset contains scanned geomagnetic magnetogram records from Macquarie Island Geomagnetic Observatory. Files names delineate the observatory, observation year, type of data, month range, folder and page. e.g. TOO 1985 GRAM - JUL - AUG - 73_00031 (TOO: Toolangi Observatory)(1985: Year)(GRAM: Magnetogram)(JUL - AUG: month range)(73_00031: Folder and page). Files are stored as station and year based PDF and individual tiff files per page.
-
This dataset contains scanned geomagnetic magnetogram records from Wilkes Geomagnetic Observatory. Files names delineate the observatory, observation year, type of data, month range, folder and page. e.g. TOO 1985 GRAM - JUL - AUG - 73_00031 (TOO: Toolangi Observatory)(1985: Year)(GRAM: Magnetogram)(JUL - AUG: month range)(73_00031: Folder and page). Files are stored as station and year based PDF and individual tiff files per page.
-
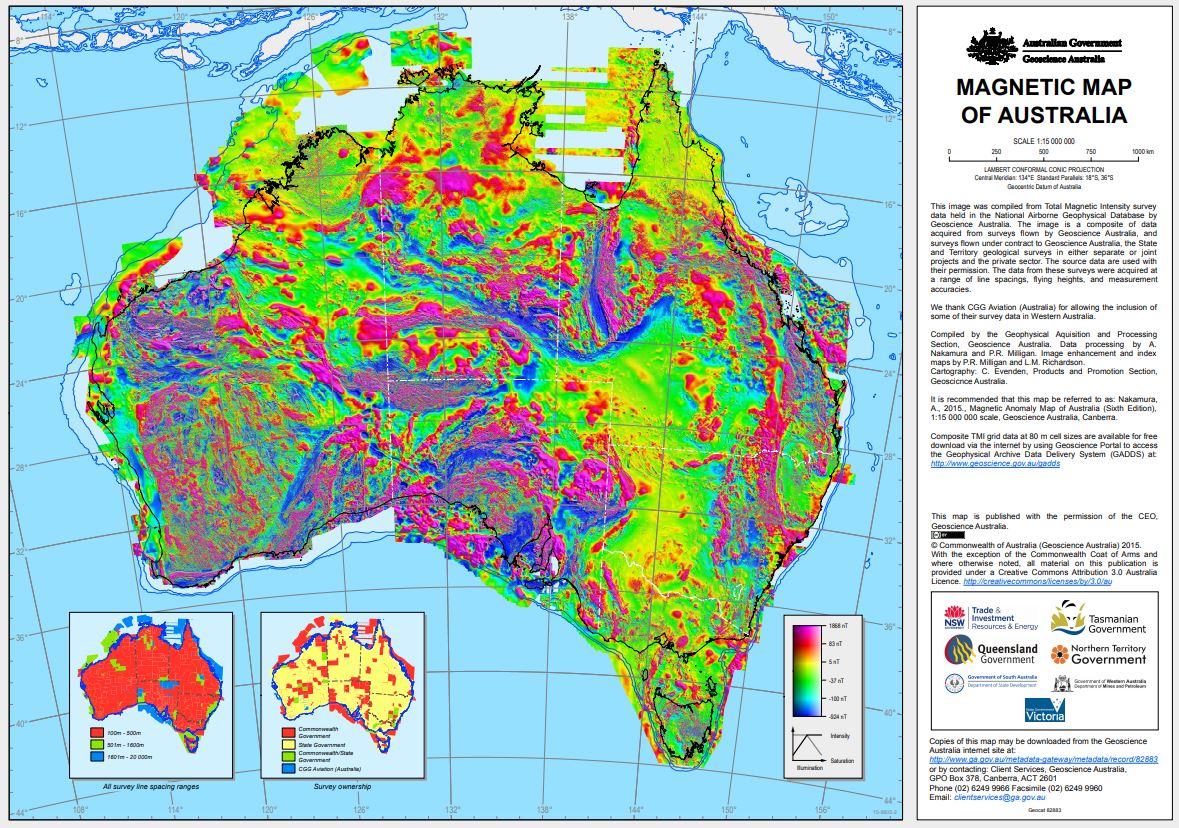
Total Magnetic Intensity colour composite image 2015 The image was created from the Total Magnetic Intensity Grid 2015 - sixth edition. This image has a cell size of ~3 seconds of arc (approximately 80 m) and has been image enhanced for optimal display in Hue-Saturation-Intensity (HSI). This image only includes airborne-derived TMI data for onshore and near-offshore continental areas. Since the fifth edition was released in 2010 data from 41 new surveys have been added to the database, acquired mainly by the State and Territory Geological Surveys. It is estimated that 31 500 000 line-kilometres of survey data were acquired to produce the grid data, 4 500 000 line-kilometres more than for the previous edition.
-
This image is a greyscale image of the Total Magnetic Intensity (TMI) Anomaly Image of Australia with Variable Reduction to Pole (VRTP). Total magnetic intensity (TMI) data measures variations in the intensity of the Earth magnetic filed caused by the contrasting content of rock-forming minerals in the Earth crust. Magnetic anomalies can be either positive (field stronger than normal) or negative (field weaker) depending on the susceptibility of the rock. A variable reduction to Pole is aimed at locating magnetic anomalies exactly above their source bodies and without any distortion. The image is created from the 2019 variable reduction to Pole of the TMI grid with a grid cell size of ~3 seconds of arc (approximately 80 m). This image only includes airborne-derived TMI data for onshore and near-offshore continental areas. The image provides a better interpretation of the magnetic data by giving an accurate location of magnetic source bodies.
-
Total magnetic intensity (TMI) data measures variations in the intensity of the Earth's magnetic field caused by the contrasting content of rock-forming minerals in the Earth crust. Magnetic anomalies can be either positive (field stronger than normal) or negative (field weaker) depending on the susceptibility of the rock. The data are processed via standard methods to ensure the response recorded is that due only to the rocks in the ground. The results produce datasets that can be interpreted to reveal the geological structure of the sub-surface. The processed data is checked for quality by GA geophysicists to ensure that the final data released by GA are fit-for-purpose. These line dataset from the GA310 South West Margin 2D MSS were acquired for Geoscience Australia in 2008/2009 as part of the Australian Government's Offshore Energy Security Program. This survey acquired a range of pre-competitive geological and geophysical data that included seismic reflection, gravity, magnetic and swath bathymetry measurements, as well as seafloor dredge samples. A total of 26,000 line-kilometres of magnetic and gravity data were acquired during this survey.
-
<div>This report contains information about the operation of Geoscience Australia’s ten permanent geomagnetic observatories, repeat stations and other relevant information covering the period from 2017 to 2021.</div><div>Information regarding the activities and services of Geoscience Australia’s Geomagnetism program, distribution of geomagnetic data, geomagnetic instrumentation and data processing procedures is also provided.</div><div><br></div>